The Science of Speed
How close did anyone get to a perfect World Cup run in 2026?
We built a perfect run for every 2026 World Cup final out of the fastest split in each sector, then measured how far each winner finished from it.
SplitZero is named after a run where you lose nothing anywhere on the track. Every racer knows that run exists in theory and almost never happens in practice. With the full 2026 World Cup season of split times in our database, we wanted to find out how close the fastest riders in the world actually got to it.
The measurement is simple. Every World Cup final is timed in five sectors: start to split 1, three split-to-split sections, and split 4 to the finish. For each final we took the fastest time anyone set in each sector and added the five together. Nobody rode that run, but every piece of it was ridden by someone in the same final, on the same track, on the same day. The gap between that sum and the winning time is how much the winner left on the hill compared with the best of the field.
We ran this on all 36 finals of the season: nine rounds, four classes. Most of this piece focuses on the elite men and women, and the junior classes come in where they change the picture.
Nobody came close
The average elite men's winner finished 1.79 seconds behind the perfect run, which is 0.93% of the winning time. For elite women the average was 2.68 seconds, or 1.19%. For context, the average winning margin this season was 1.45 seconds in elite men's finals and 1.23 seconds in elite women's. On average, the perfect run would have beaten the actual winner by more than the winner beat second place.
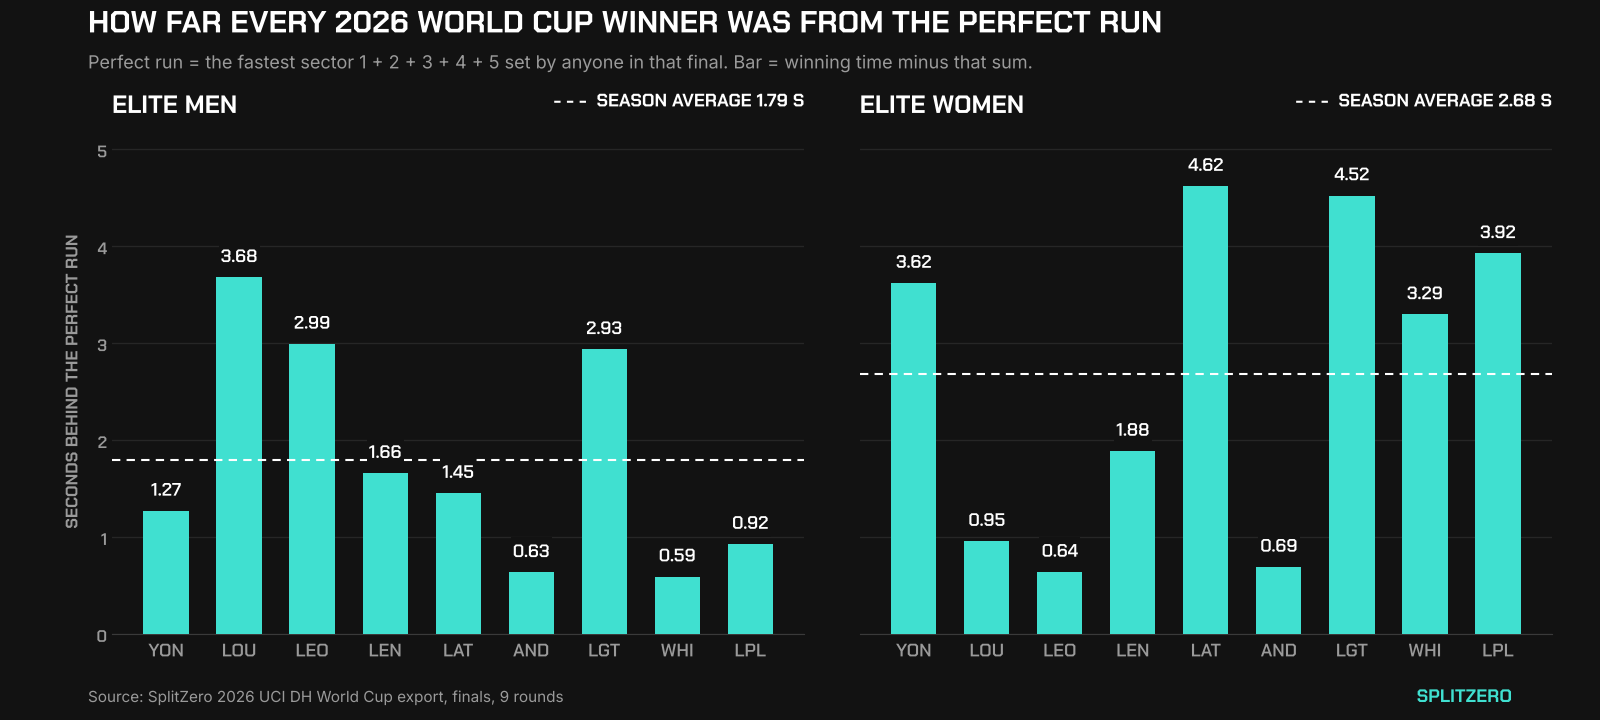
| Round | Men's winner | Behind perfect run | Women's winner | Behind perfect run |
|---|---|---|---|---|
| Yongpyong | Asa Vermette | 1.27 s | Valentina Höll | 3.62 s |
| Loudenvielle | Luca Shaw | 3.68 s | Valentina Höll | 0.95 s |
| Leogang | Finn Iles | 2.99 s | Valentina Höll | 0.64 s |
| Lenzerheide | Finn Iles | 1.66 s | Anna Newkirk | 1.88 s |
| La Thuile | Jordan Williams | 1.45 s | Valentina Höll | 4.62 s |
| Pal Arinsal | Jordan Williams | 0.63 s | Valentina Höll | 0.69 s |
| Les Gets | Max Alran | 2.93 s | Harriet Harnden | 4.52 s |
| Whistler | Asa Vermette | 0.59 s | Valentina Höll | 3.29 s |
| Lake Placid | Luke Meier-Smith | 0.92 s | Lisa Bouladou | 3.92 s |
Vermette's Whistler run is the closest thing to a perfect run in the elite fields this year. He was fastest in four of the five sectors and third in the first, and he won by 4.37 seconds, the largest elite men's margin of the season. Jordan Williams at Pal Arinsal and Valentina Höll at Leogang were the only other elite winners within 0.65 seconds of the composite.
At the other end, Höll won La Thuile 4.62 seconds behind the perfect run, and Harriet Harnden won Les Gets 4.52 seconds behind it. A run can be far from perfect and still be the fastest one that day.
Winners don't win every sector
There were 90 elite sector wins available in 2026: five sectors in 18 finals. The race winners took 34 of them, which is 38%. The typical elite winner was fastest in two sectors. In the sectors they didn't win, their median rank was 4th.
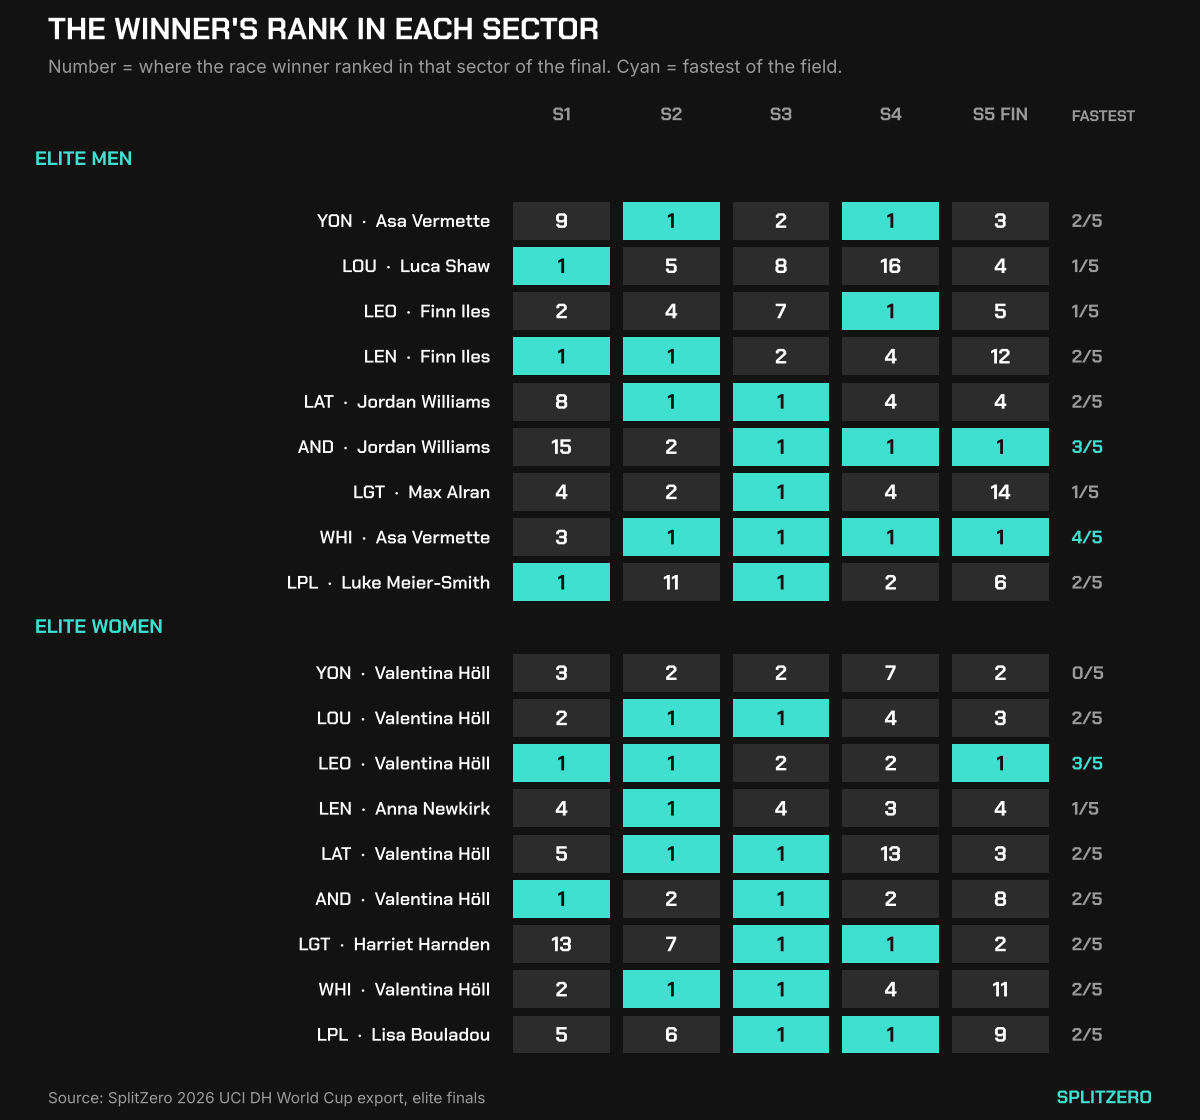
Two results stand out. Höll won the opening round at Yongpyong without being fastest in a single sector. Her sector ranks were 3, 2, 2, 7 and 2, and five different riders owned the five sectors. The fastest sector 2 that day came from a run that finished 14th of 15, almost 18% off the winning time, so it was a fast section inside a run that went wrong further down. At Loudenvielle, Luca Shaw had only the 16th-fastest sector 4 time and still won by 0.127 seconds. Again, five different riders owned the five sectors.
Big losses in a single sector were common among winners. Eight of the 18 elite winners had at least one sector where they ranked 11th or worse, including Finn Iles at Lenzerheide (12th in the finish sector), Max Alran at Les Gets (14th in the finish sector) and Jordan Williams at Pal Arinsal (15th in sector 1).
Where winners lose the most: the finish sector
The finish sector was the shortest of the five in all 18 elite finals. On average it took 13% of the run time, against 18–26% for each of the other four sectors. It is also where winners lost the most time relative to the best in the field.
| Sector | Share of run time (median) | Elite men's winner, behind the fastest | Elite women's winner, behind the fastest |
|---|---|---|---|
| S1 | 19% | 0.35 s (1.0%) | 0.57 s (1.5%) |
| S2 | 26% | 0.29 s (0.7%) | 0.52 s (1.1%) |
| S3 | 23% | 0.30 s (0.7%) | 0.19 s (0.4%) |
| S4 | 18% | 0.39 s (1.3%) | 0.61 s (1.4%) |
| S5 (finish) | 13% | 0.46 s (1.7%) | 0.80 s (2.7%) |
Percentages are the winner's loss divided by the fastest time in that sector, averaged over nine finals.
Measured against the sector's own length, elite women's winners lost 2.7% in the finish sector, about six times what they lost in sector 3. The winner set the fastest finish sector in only 3 of the 18 elite finals. The rider who did set it finished the final in a median position of 3rd, and twice in 12th.
The data shows where the time went, not why. A rider who has already lost time upstream has nothing to protect and can attack the last section. A rider on a winning pace may be riding the bottom of the track more conservatively. Both explanations fit the numbers, and split times alone can't separate them. What the data does support is practical. If you are working on your own runs, the last 13% of the track costs more than its length suggests. It deserves a dedicated look in course walks and in your own split data.
The only three perfect runs were in junior racing
In 3 of the 36 finals, the winner was fastest in all five sectors, which means the winning run was the perfect run.
| Round | Class | Winner | Field size | Winning margin |
|---|---|---|---|---|
| Lenzerheide | Men Junior | Jonty Williamson | 18 | 3.70 s |
| Les Gets | Women Junior | Aletha Ostgaard | 10 | 6.47 s |
| Whistler | Women Junior | Aletha Ostgaard | 10 | 9.21 s |
All three came from the junior classes. This does not mean junior runs were cleaner than elite runs. Junior finals have smaller fields: 17 to 20 riders for junior men and 9 to 10 for junior women, against about 30 for elite men. With fewer riders, there are fewer chances for someone else to set a faster sector. Across all 36 finals, the number of sectors the winner owned went down as field size went up (correlation −0.31). That doesn't take anything away from the three rides, but it does mean the junior and elite numbers shouldn't be compared directly.
Checking the headline against a second metric
The perfect run has a built-in bias. It takes the single most extreme performance in each sector out of 14 to 30 runs, so it is bound to be fast. Part of the 1.79-second gap could simply be the statistics of picking five maximums, rather than anything the winner did wrong.
To check this, we built a second composite from the second-fastest time in each sector. Against that run, the elite men's winners averaged 0.10 seconds faster, and the elite women's winners 0.30 seconds slower. Put simply, a World Cup winner rides about as fast as a run made from the runner-up time in every sector.
That changes how the headline should be read. Most of the gap to the perfect run doesn't come from winners making mistakes. It comes from how far the single best sector performances stand out from everyone else's. The headline figure is still correct: no elite winner came within half a second of the composite. But it is a measure of how spread out sector speed is across a World Cup field, not a count of the winners' errors.
Running the same check on your own splits
The same calculation works for one rider across one weekend. Take your fastest time in each sector from your timed runs, add them up, and compare the sum with your best full run. In the 2026 World Cup data, elite riders with at least two qualifying or final runs at a round had a median gap of 0.31 seconds (men) and 0.16 seconds (women) between their best run and their own composite. That number belongs to you rather than to the field, and it points straight at the sector worth working on next.
SplitZero — The Science of Speed.
Sources: UCI Mountain Bike World Series (official 2026 UCI Downhill World Cup results and timing); split times from the SplitZero results database, exported 2026-10-18.
Methodology: All 36 finals of the nine 2026 UCI Downhill World Cup rounds (elite and junior, men and women), valid finishing times only. Sectors are the official split-to-split intervals; the perfect run is the sum of the fastest time in each of the five sectors within a single final. The second-metric check uses the second-fastest time per sector. World Championships are not included.