The Science of Speed
Which Junior Improved the Most, 2025–2026?
We measured every junior's gap to the World Cup winner across both seasons — and asked what the biggest improvers actually had in common.
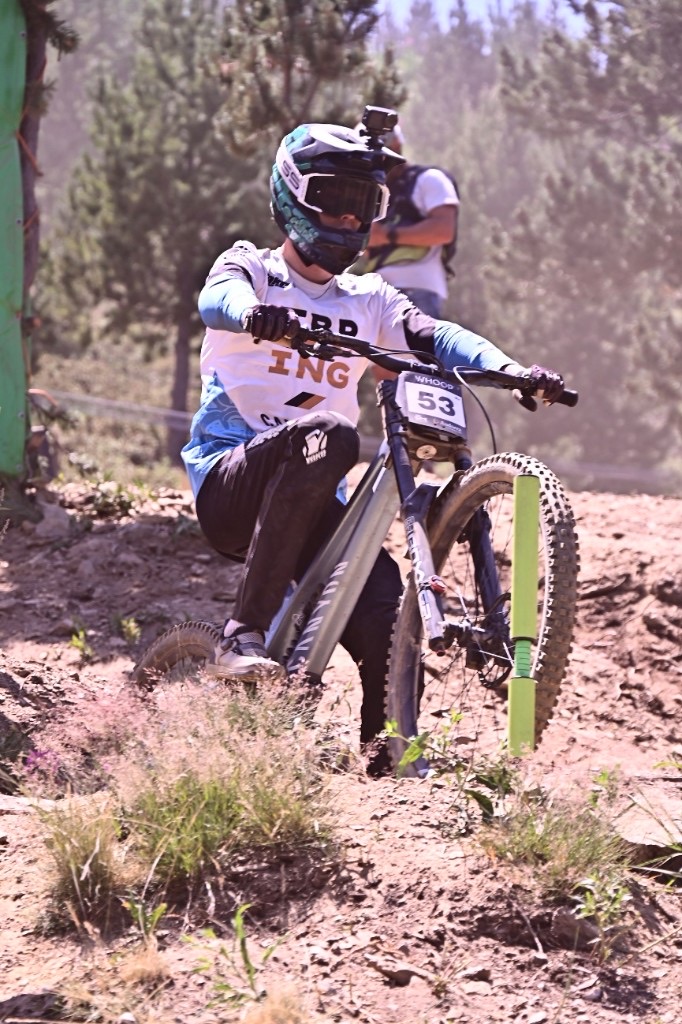
A downhill qualifying run is just a number. SplitZero exists because that number should tell you more than "faster" or "slower than last time" — it should tell you where you actually stand, against who, and what to do about it. So we ran our own dataset through the question every racer, parent and coach asks every October: is the winter actually working?
We pulled qualifying times from every UCI Downhill World Cup round in 2025 and 2026 — Elite Men and Men Junior — for riders who raced Junior in 2025 and Junior or Elite in 2026. For each rider, each round, we measured one number: their best qualifying time, as a percentage of the Elite Men winner's best qualifying time, that round. "Best" means the faster of Q1 and Q2 where a rider has both. Q2 only exists for Elite riders who miss the top-20 cut in Q1 — Juniors don't have a Q2 in the current race format, so for them "best" is simply Q1. We've also worked out each rider's Q1-only gap as a cross-check, using the same method, and note it wherever the two numbers pull apart by more than a point or two. Normalizing against the winner removes track length and difficulty, so a rider's number holds up across a season and across years. A rider "improved" when that gap got smaller from 2025 to 2026.
A couple of things worth flagging up front:
- This measures qualifying pace, not results. We didn't pull finals data, race points, or series standings — only Q1 and Q2 times. "Closed the gap" means closed the gap in qualifying speed to the winner, nothing else.
- Sample sizes are small — most riders have 3 to 10 qualifying rounds a season — so we excluded any single round where a rider's gap was unusually large relative to their own season (the kind of number a crash or a bad-luck run produces), and only ranked riders with at least 3 qualifying rounds in both seasons. Every number below is the "abnormality-excluded" version unless we say otherwise.
Finland's case: improving despite the conditions, not because of them
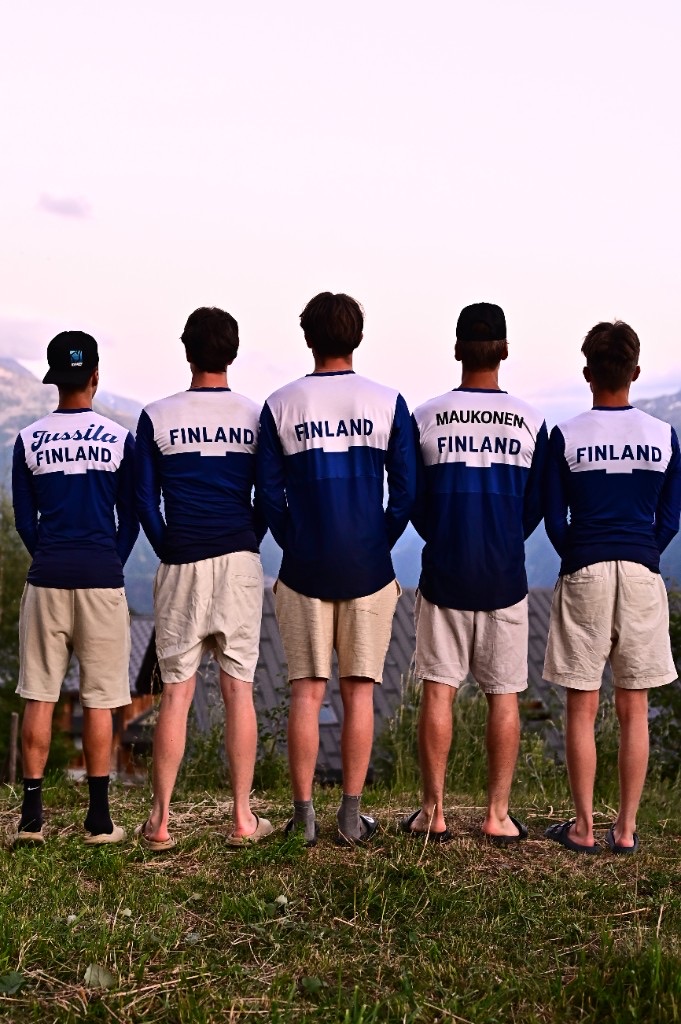
Start close to home. Oskari Känsälä and Joonas Jussila both race for the Finnish national team, training through a cold, snowy winter with limited daylight — but with lift-assisted riding available, which is what made the winter work.
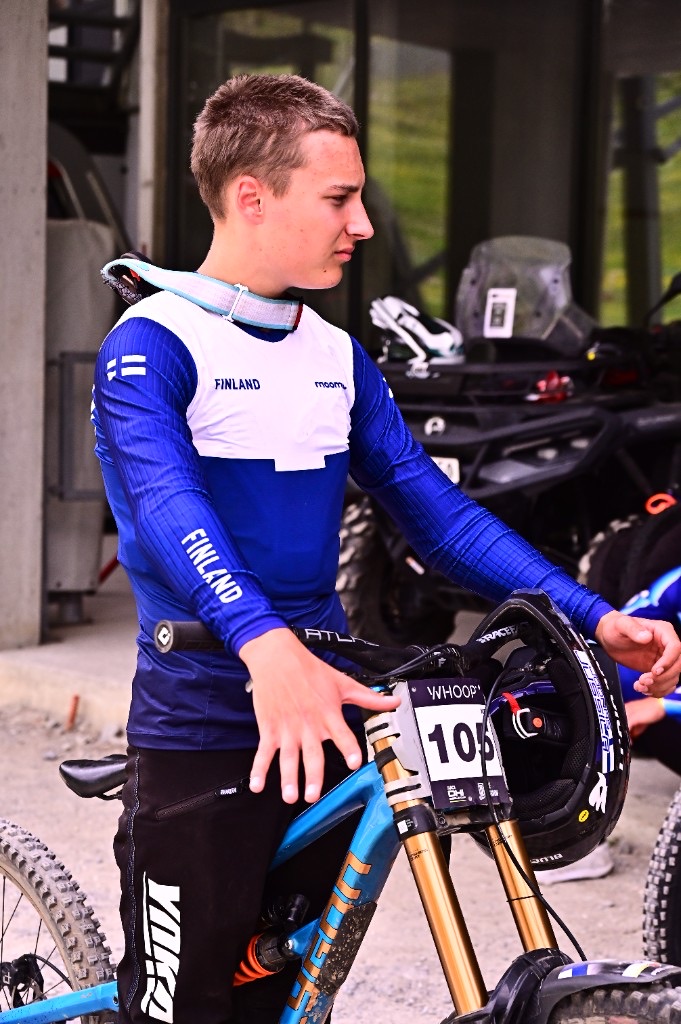
Oskari Känsälä (Junior) improved 7.91 percentage points on the elite winner between 2025 and 2026 — his season-average qualifying gap dropped from 20.25% back to 12.34% back, well clear of the 4.6-point field median (below). On the Q1-only cross-check, his improvement is +6.77 — smaller, but still comfortably ahead of the field. His actual position within the Junior field moved too, from an average top-81% finish in 2025 to top-71% in 2026. One nice anecdote, if not a season average: the one track that appears in both years, La Thuile, went from 16.6% back in 2025 to 10.5% back in 2026.
Joonas Jussila moved from the Junior field into Elite for 2026 and improved 4.59 points on the winner, from 13.23% back to 8.64% back — that comparison is always against the Elite winner, so the class change doesn't affect this number directly. On the Q1-only cross-check his improvement drops to +2.98, the sharpest drop of anyone in this piece, worth noting rather than glossing over. His field-position number does reflect the class change, since that's measured within his own category: top-72% as a Junior in 2025 to top-90% in the deeper Elite field in 2026.
Both are good results. Based on the data, we can say something concrete: riders can be improved and developed in Finland over the winter.
Tornari Bikepark stayed open through the winter specifically to keep both riders riding. The tracks weren't just kept open — they were shaped by the data. We used SplitZero's AI analysis, which looks at every split each rider has ridden over the season alongside the terrain characteristics of that split, to identify their individual weaknesses and strengths. Based on that, the training tracks at Tornari Bikepark were built to provide the kind of sections where each rider had the most to gain.
Which raises the question we actually set out to answer.
Who improved the most, and what did they have in common?
We ran the same calculation across every junior with enough qualifying data to trust — 46 riders with at least 3 rounds in both seasons. The field median improvement was 4.6 percentage points. Känsälä's 7.91-point improvement is well clear of that median.
It's also not the best in the field. Here's the actual top 10, with the Q1-only cross-check alongside each number:
| Rank | Rider | Category | Improvement | Q1-only |
|---|---|---|---|---|
| 1 | Tobias Debin | Elite | +22.97 pts | +17.21 pts — still #1, smaller margin |
| 2 | Orlando Rafe Hudson | Junior | +16.75 pts | +15.72 pts — holds up |
| 3 | Rhys Welings | Junior | +13.98 pts | +13.98 pts — identical |
| 4 | Kamil Tymon | Junior | +13.90 pts | +13.43 pts — holds up |
| 5 | Daragh Ryan | Junior | +12.68 pts | +12.49 pts — holds up |
| 6 | Maksimilijonas Saudargas | Junior | +10.68 pts | +10.69 pts — identical |
| 7 | Oliver Colthup | Junior | +10.12 pts | +7.92 pts — smaller, still solid |
| 8 | Felix Griffiths | Junior | +9.90 pts | +9.67 pts — holds up |
| 9 | Noé Forlin | Junior | +8.54 pts | +8.41 pts — holds up |
| 10 | Luke Malen | Junior | +8.32 pts | +7.03 pts — smaller, still real |
| 11 | Oskari Känsälä (FIN) | Junior | +7.91 pts | +6.77 pts — smaller, still well clear of median |
Most of this list holds up no matter which qualifying run you count — seven of the ten barely move. Two are worth flagging: Colthup and Malen lean a bit more on Q2 results than the rest of the top 10, so their Q1-only numbers, while still real improvements, are less dramatic than the headline figure.
Everyone here raced the same World Cup rounds in the same two seasons. The field median improvement was 4.6 points, and the top 10 improved between 8 and 23 points — a real spread. So the question is: what's the top of this list doing that the middle of it isn't?
We had a working theory before we looked: that the biggest gains go to riders who (a) get to keep riding through the Northern winter instead of stopping, and (b) train regularly alongside people faster than they are. Before chasing that story, though, we checked the leaderboard itself, because a large percentage gap is easy to produce without it meaning much.
Checking our own number first
Closing a big percentage gap to the winner is a different thing from actually moving up the field. A rider who starts a long way off the pace only needs to get a bit faster to shrink a large gap by a lot, without climbing many places. So alongside the gap-to-winner percentage, we checked every rider in the top 10 against something more direct: what percentage of their own category they finished within, event by event, averaged across the season. Same convention as any race result — lower is better, "top 10%" is a strong finish, "top 90%" means you're closer to last than first.
For example: if a category has 68 riders at a given round and you qualify 64th, that's the top 94% — you're basically at the back. Qualify 7th, and that's the top 10% — near the very front. We averaged this across each rider's season, both years, and added a plain-language tier (top 10% / top 25% / top half / back half) so it reads at a glance too. To keep this on the same footing as the gap-% number above, position here is ranked by each rider's best qualifying time (the same faster-of-Q1-or-Q2 basis used throughout this piece), not by Q1 alone.
| Rider | Gap-% | 2025 field | 2026 field | Tier | Moved? |
|---|---|---|---|---|---|
| Tobias Debin | +22.97 | top 85% | top 97% | back half → back half | No — actually slid backward |
| Orlando Rafe Hudson | +16.75 | top 92% | top 76% | back half → back half | Yes |
| Kamil Tymon | +13.90 | top 94% | top 83% | back half → back half | Yes, modest |
| Daragh Ryan | +12.68 | top 75% | top 49% | back half → top half | Yes |
| Maksimilijonas Saudargas | +10.68 | top 84% | top 73% | back half → back half | Yes, modest |
| Oliver Colthup | +10.12 | top 77% | top 36% | back half → top half | Yes |
| Felix Griffiths | +9.90 | top 51% | top 30% | back half → top 30% | Yes |
| Noé Forlin | +8.54 | top 59% | top 20% | back half → top 25% | Yes — largest mover |
| Luke Malen | +8.32 | top 39% | top 23% | top half → top 25% | Yes, modest |
| Rhys Welings | +13.98 | top 67% | top 39% | back half → top half | Yes |
That check is reassuring more often than not: nine of the ten riders on this leaderboard did genuinely climb their own field, some of them a long way. Forlin went from a top-59% finish to a top-20% finish, the single largest field-position gain in the top 10, with Colthup, Griffiths and Hudson not far behind. The one exception is the rider with the single biggest percentage number — and on the corrected basis, it's a sharper exception than we first reported. Tobias Debin's +22.97, the largest gap-closing figure in the field, doesn't correspond to a real jump up the order: in 2025 he finished, on average, in the top 85% of the Junior field, and in 2026 the top 97% of the tougher Elite field he'd just aged into. That's not "flat" — it's a decline in relative field position, in the same season his percentage gap to the winner improved more than anyone else's in the dataset. We're not going to quietly drop him from the leaderboard because the follow-up number doesn't flatter him — catching exactly this kind of thing is the reason we built the follow-up check in the first place.
Big leaps that also landed at the front
There's a second way to read that table: not who moved the most, but who moved the most and actually finished near the front of their category in 2026. Two identical-looking percentage jumps can mean very different things — one because a rider caught up from a long way back, one because a rider is now actually fast. Filtering the top 10 to riders who finished, on average, in the top third of their category in 2026 leaves four names: Noé Forlin (top 20%), Luke Malen (top 23%), Felix Griffiths (top 30%), and Oliver Colthup (top 36%, just outside the cut but close enough to keep in this group). All four are Junior category, and all four show real field-position gains, not the pattern Debin's number produces. Which leaves the question this piece was written to answer: what do these riders have in common?
Why we built this
SplitZero exists to replace "I think I'm faster" with a number you can actually stand behind. This analysis is that same instinct pointed at a public dataset instead of a private one — the same qualifying-gap math, the same season-over-season comparison, that the app runs on your own results. Track your own gap to the win, split by split.
SplitZero — The Science of Speed.
Sources: 2025 UCI Mountain Bike World Cup · 2026 UCI Mountain Bike World Cup
Methodology note: full rider-by-rider data available on request. Improvement rankings exclude any single-round gap more than 1.2x a rider's own season-median gap (removes crash/one-off outlier rounds without removing genuinely fast or slow riders); riders are ranked only if they have qualifying data in at least 3 rounds in both 2025 and 2026.